R DataViz GalleryGraphics on this page were created using R-v3.3.3 (R Core Team, 2016), and the following R-packages:
base-v3.3. (R Core Team, 2016), bibtex-v0.4. (Francois, 2014), cairoDevice-v2.24. (Lawrence, 2015), car-v2.1. (Fox & Weisberg, 2011), DBI-v0.7. (Databases, 2014), dplyr-v0.5. (Wickham & Francois, 2015), extrafont-v0.17. (Chang, 2014), ggplot2-v2.2. (Wickham, 2009), gWidgets-v0.0. (Verzani, 2014), gWidgetsRGtk2-v0.0. (Lawrence & Verzani, 2014), igraph-v1.0. (Csardi & Nepusz, 2006), knitr-v1.16. (Xie, 2015), pander-v0.6. (Daroczi & Tsegelskyi, 2015), plyr-v1.8. (Wickham, 2011), RGtk2-v2.20. (Lawrence & Temple Lang, 2010), rmarkdown-v1.5. (J. Allaire et al., 2016), RQDA-v0.2. (Huang, 2014), RSQLite-v1.0. (Wickham, James, & Falcon, 2014), scales-v0.4. (Wickham, 2016a), tidyr-v0.6. (Wickham, 2016b), ggthemes-v3.4. (Arnold, 2016), kableExtra-v0.2. (Zhu, 2016), tufte-v0.2. (Xie & Allaire, 2016), devtools-v1.13. (Wickham & Chang, 2016), sysfonts-v0.5. (Qiu & others, 2015), showtext-v0.4. (Qiu, 2015), Riley-v0.1. (Smith-Hunter, 2017), and stats-v3.3. (Team & worldwide, 2017)
ggplot2 packageggplot2 packageBase R GraphicsRiley Packageggplot2 packageigraph & arcdiagram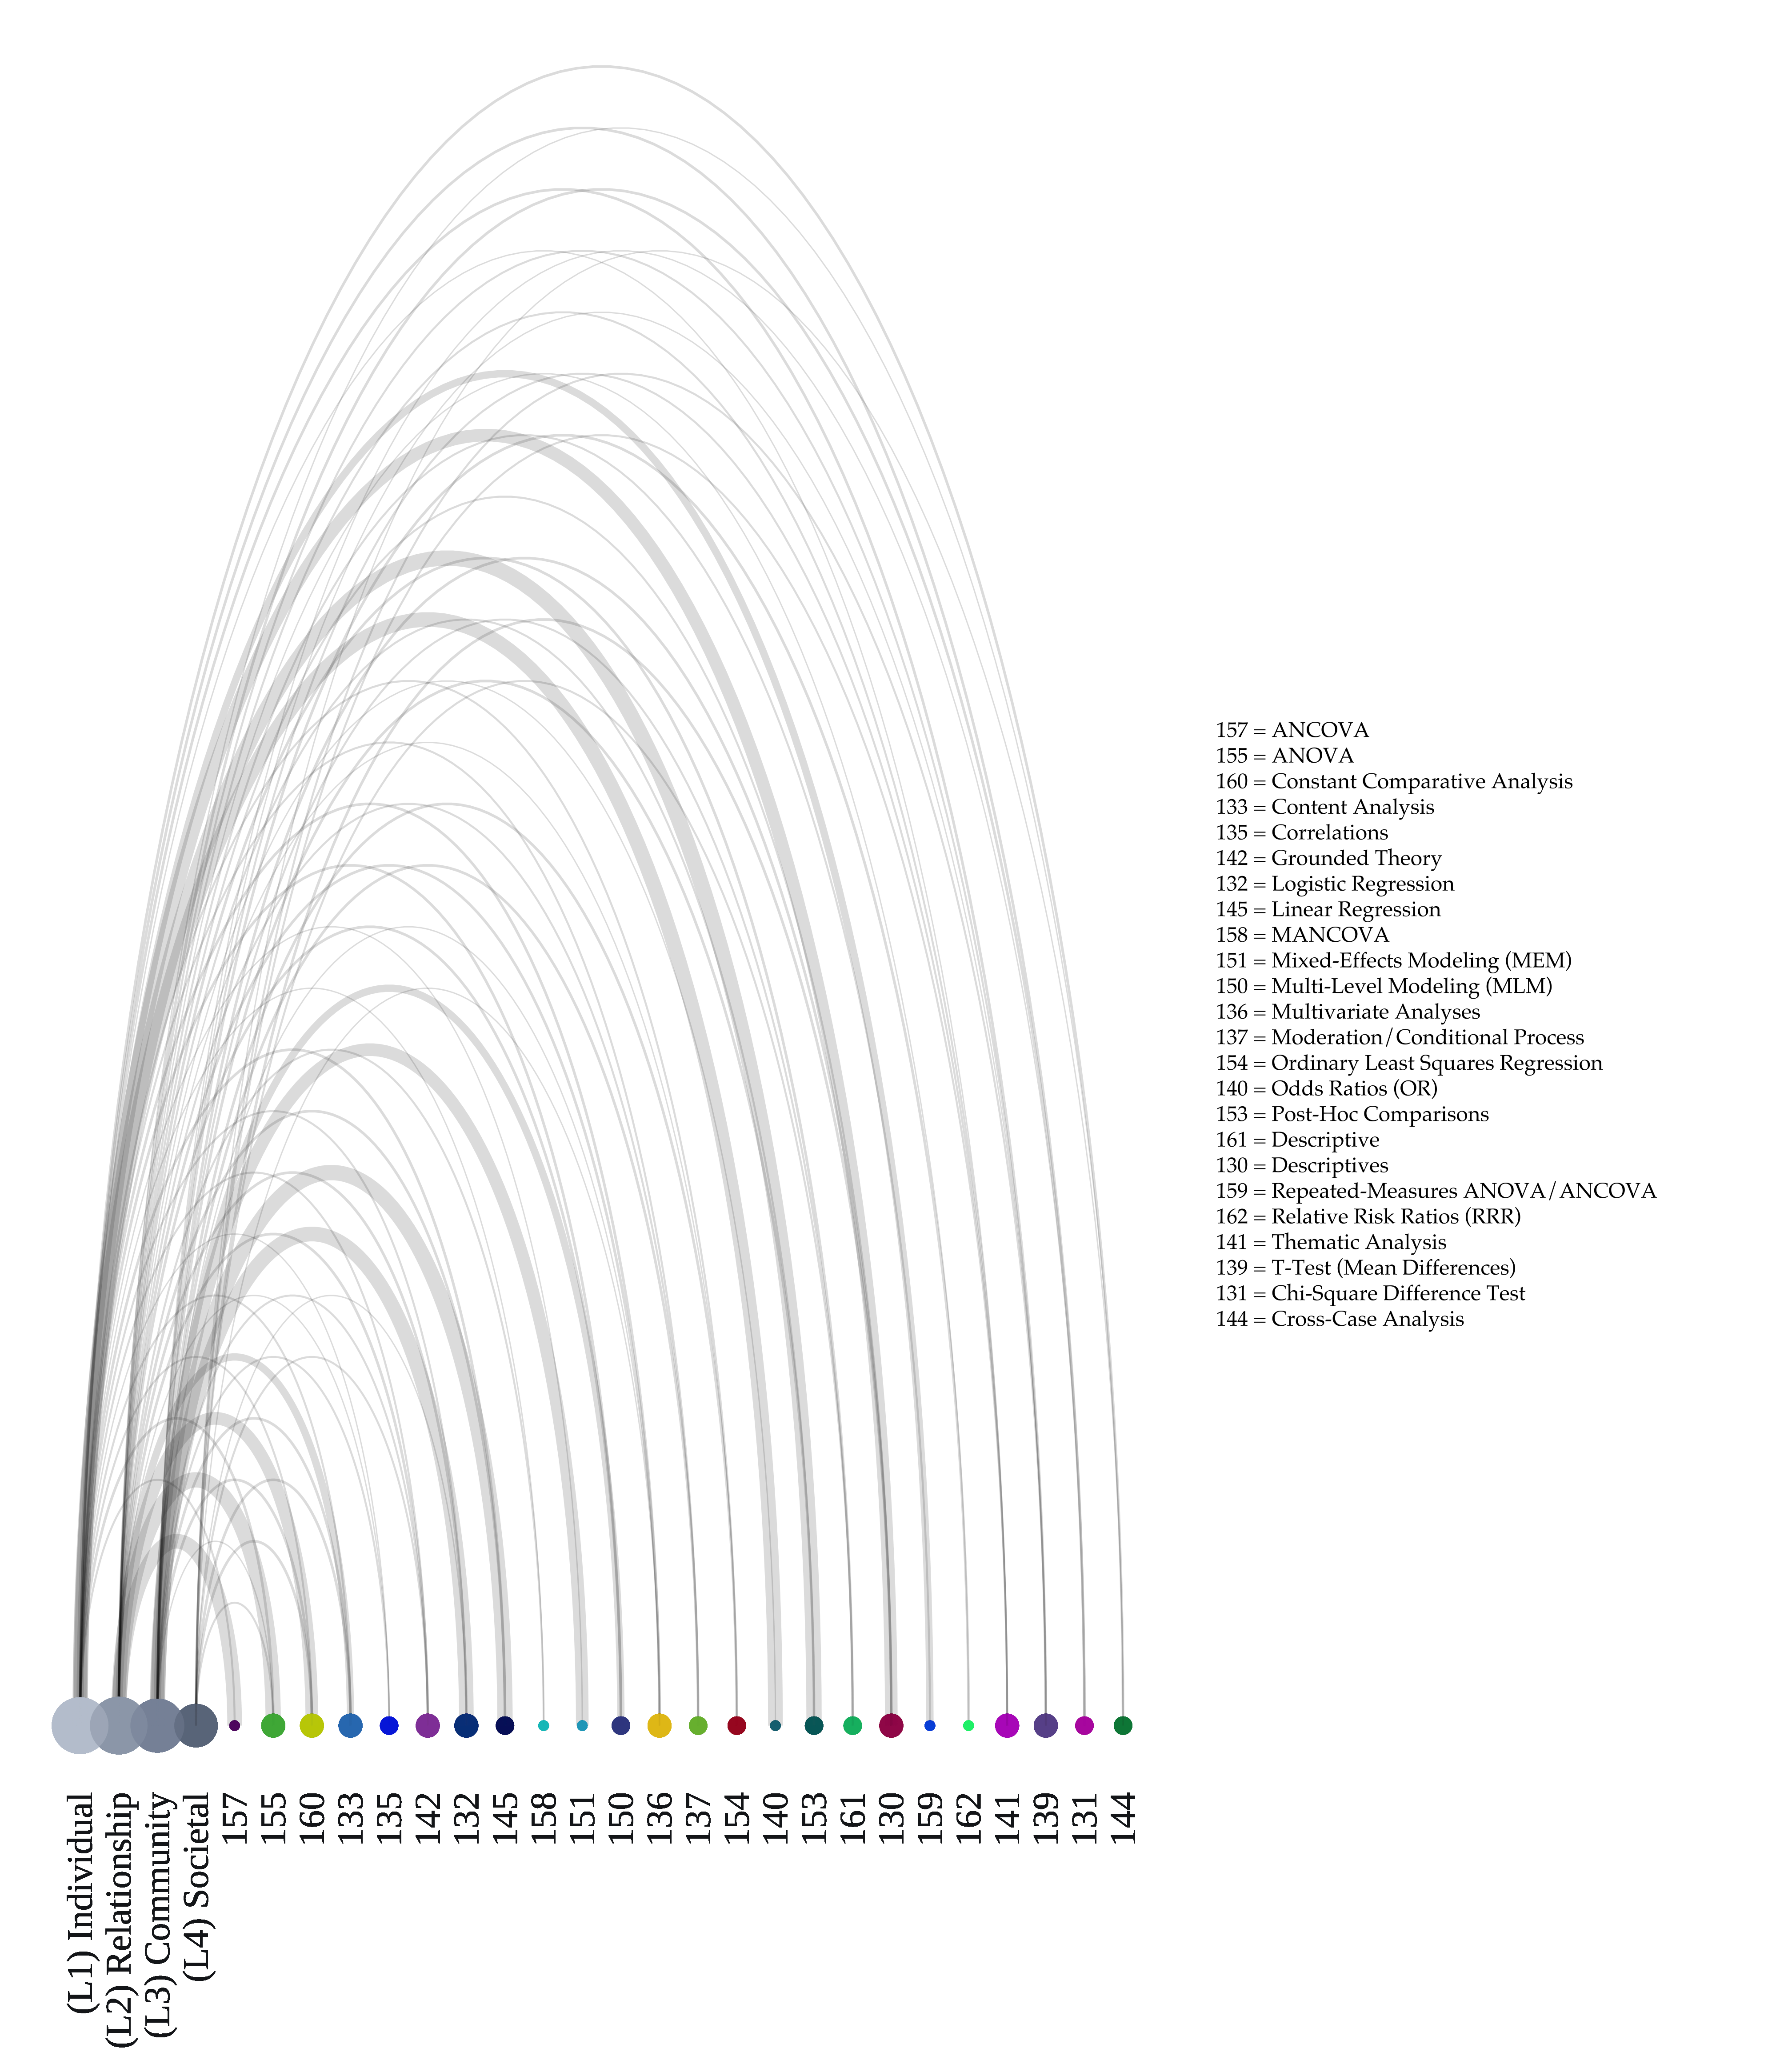
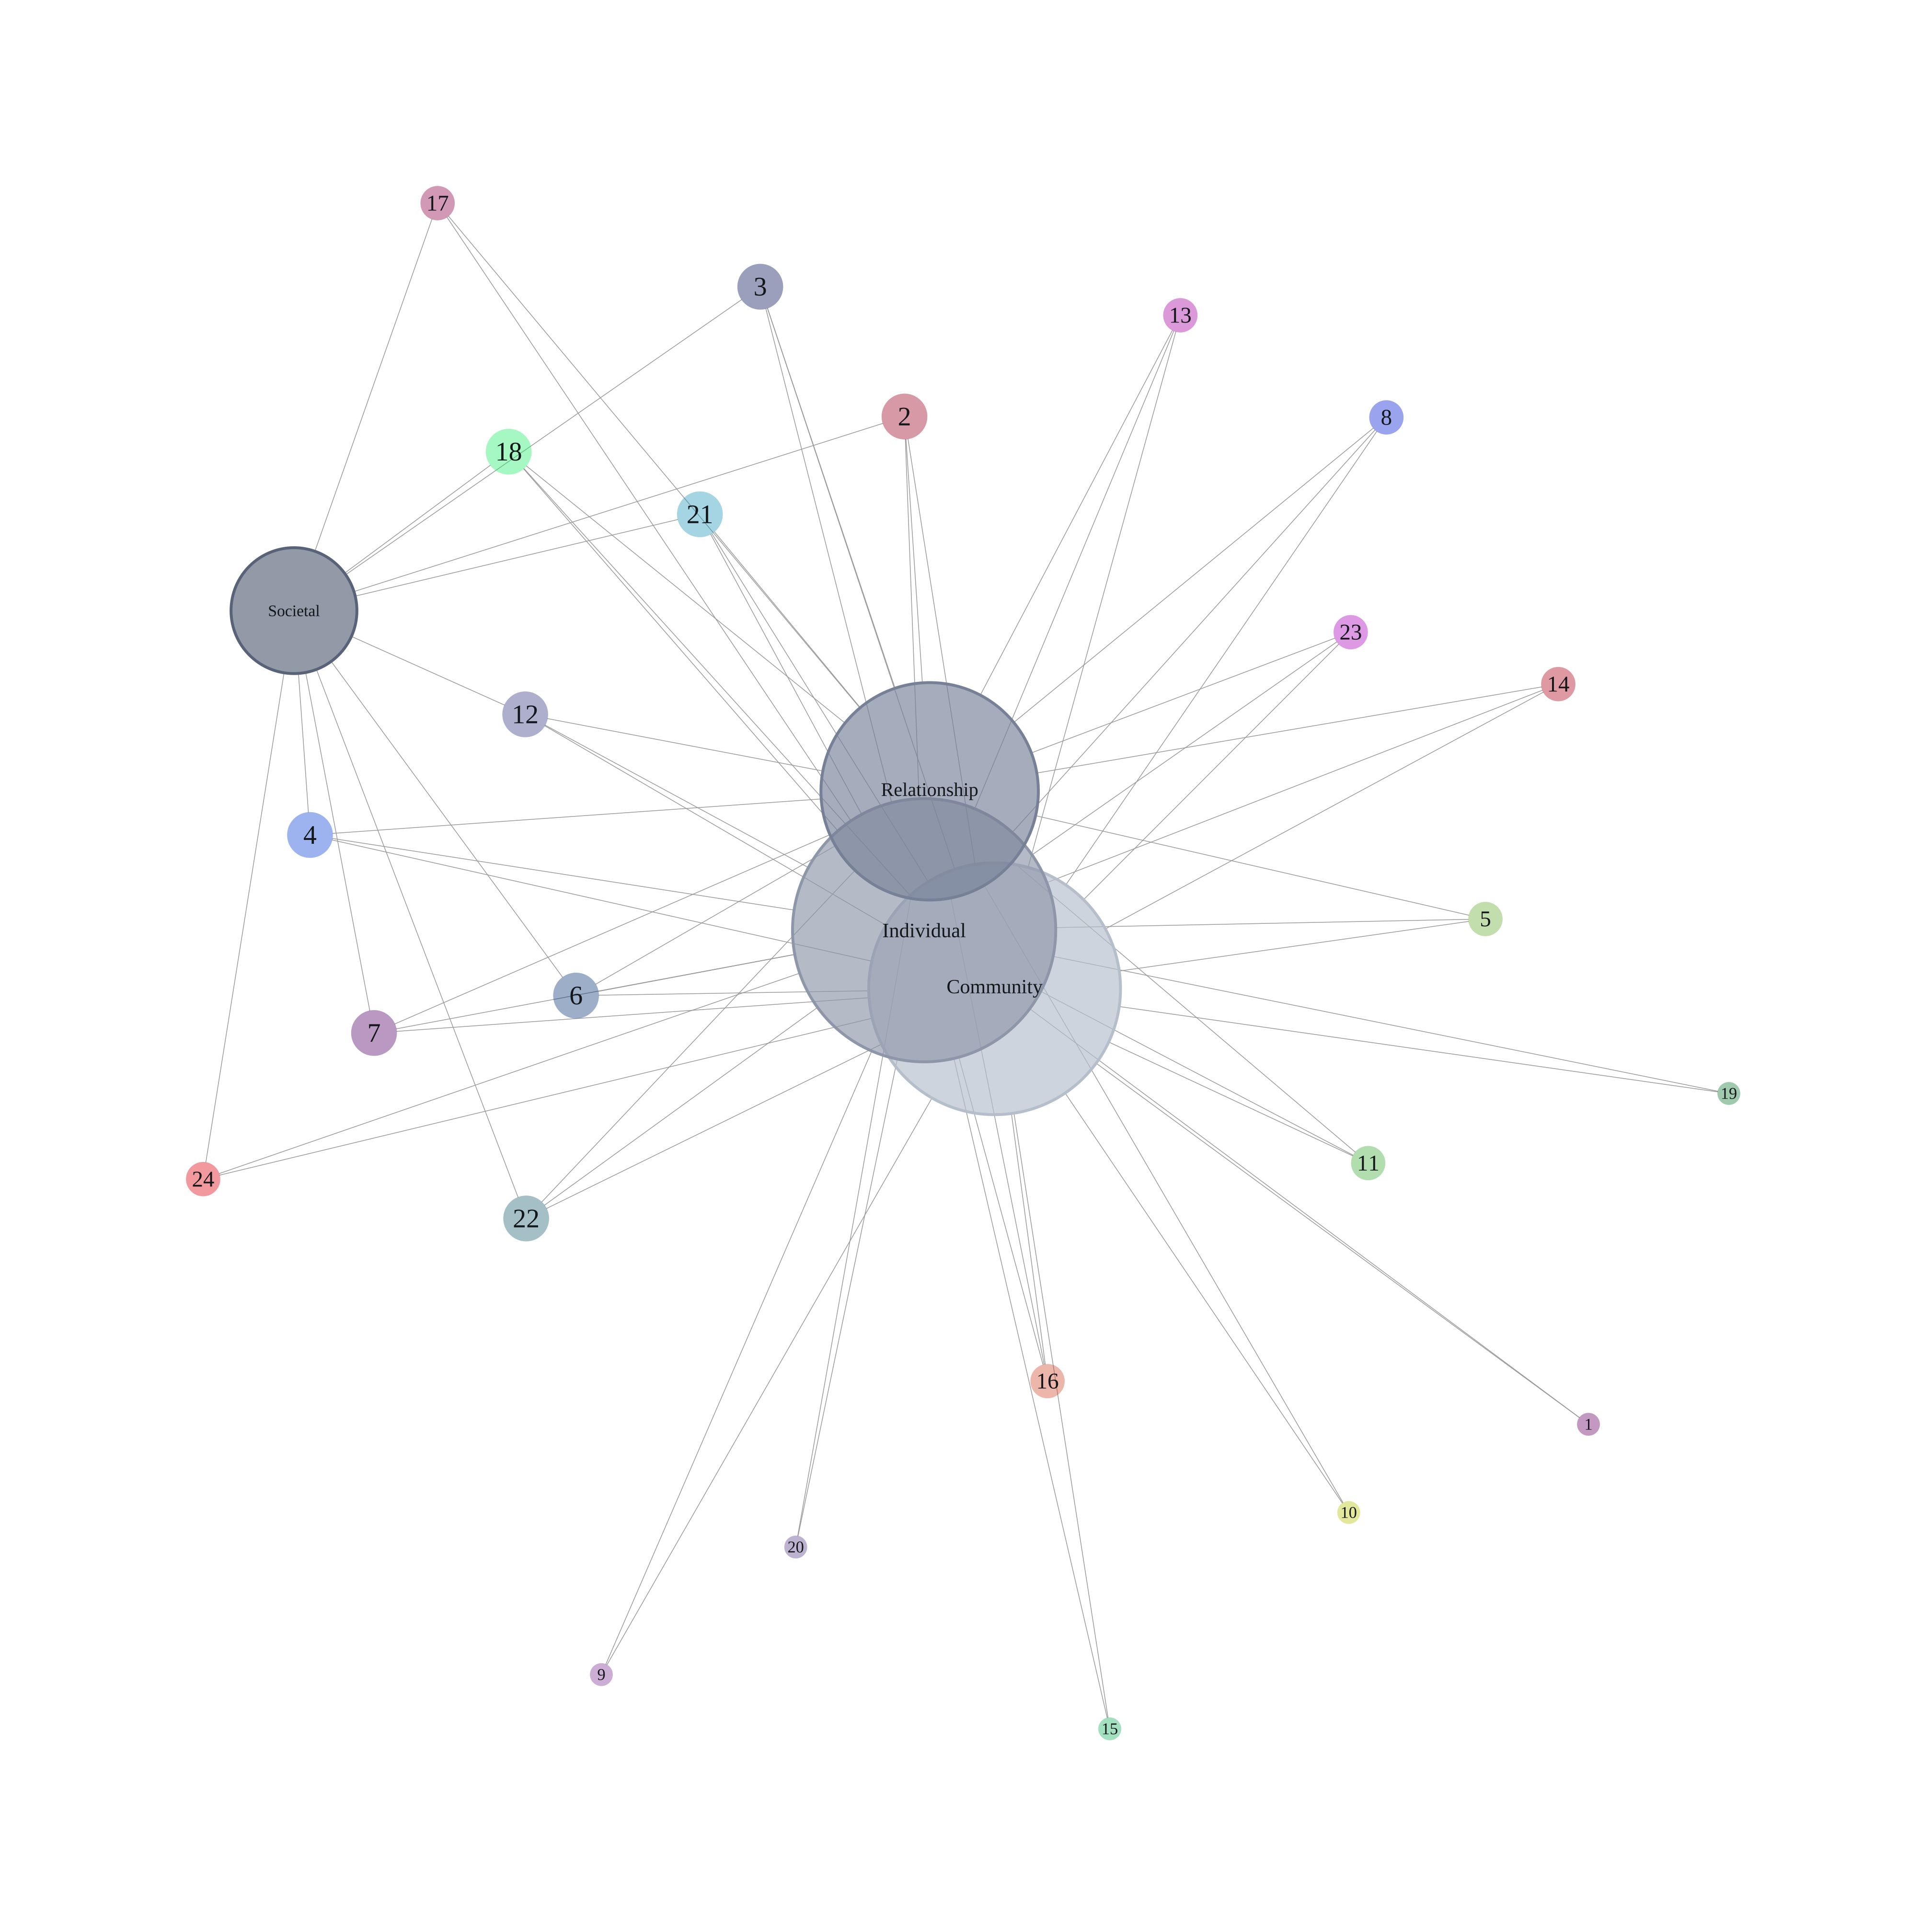
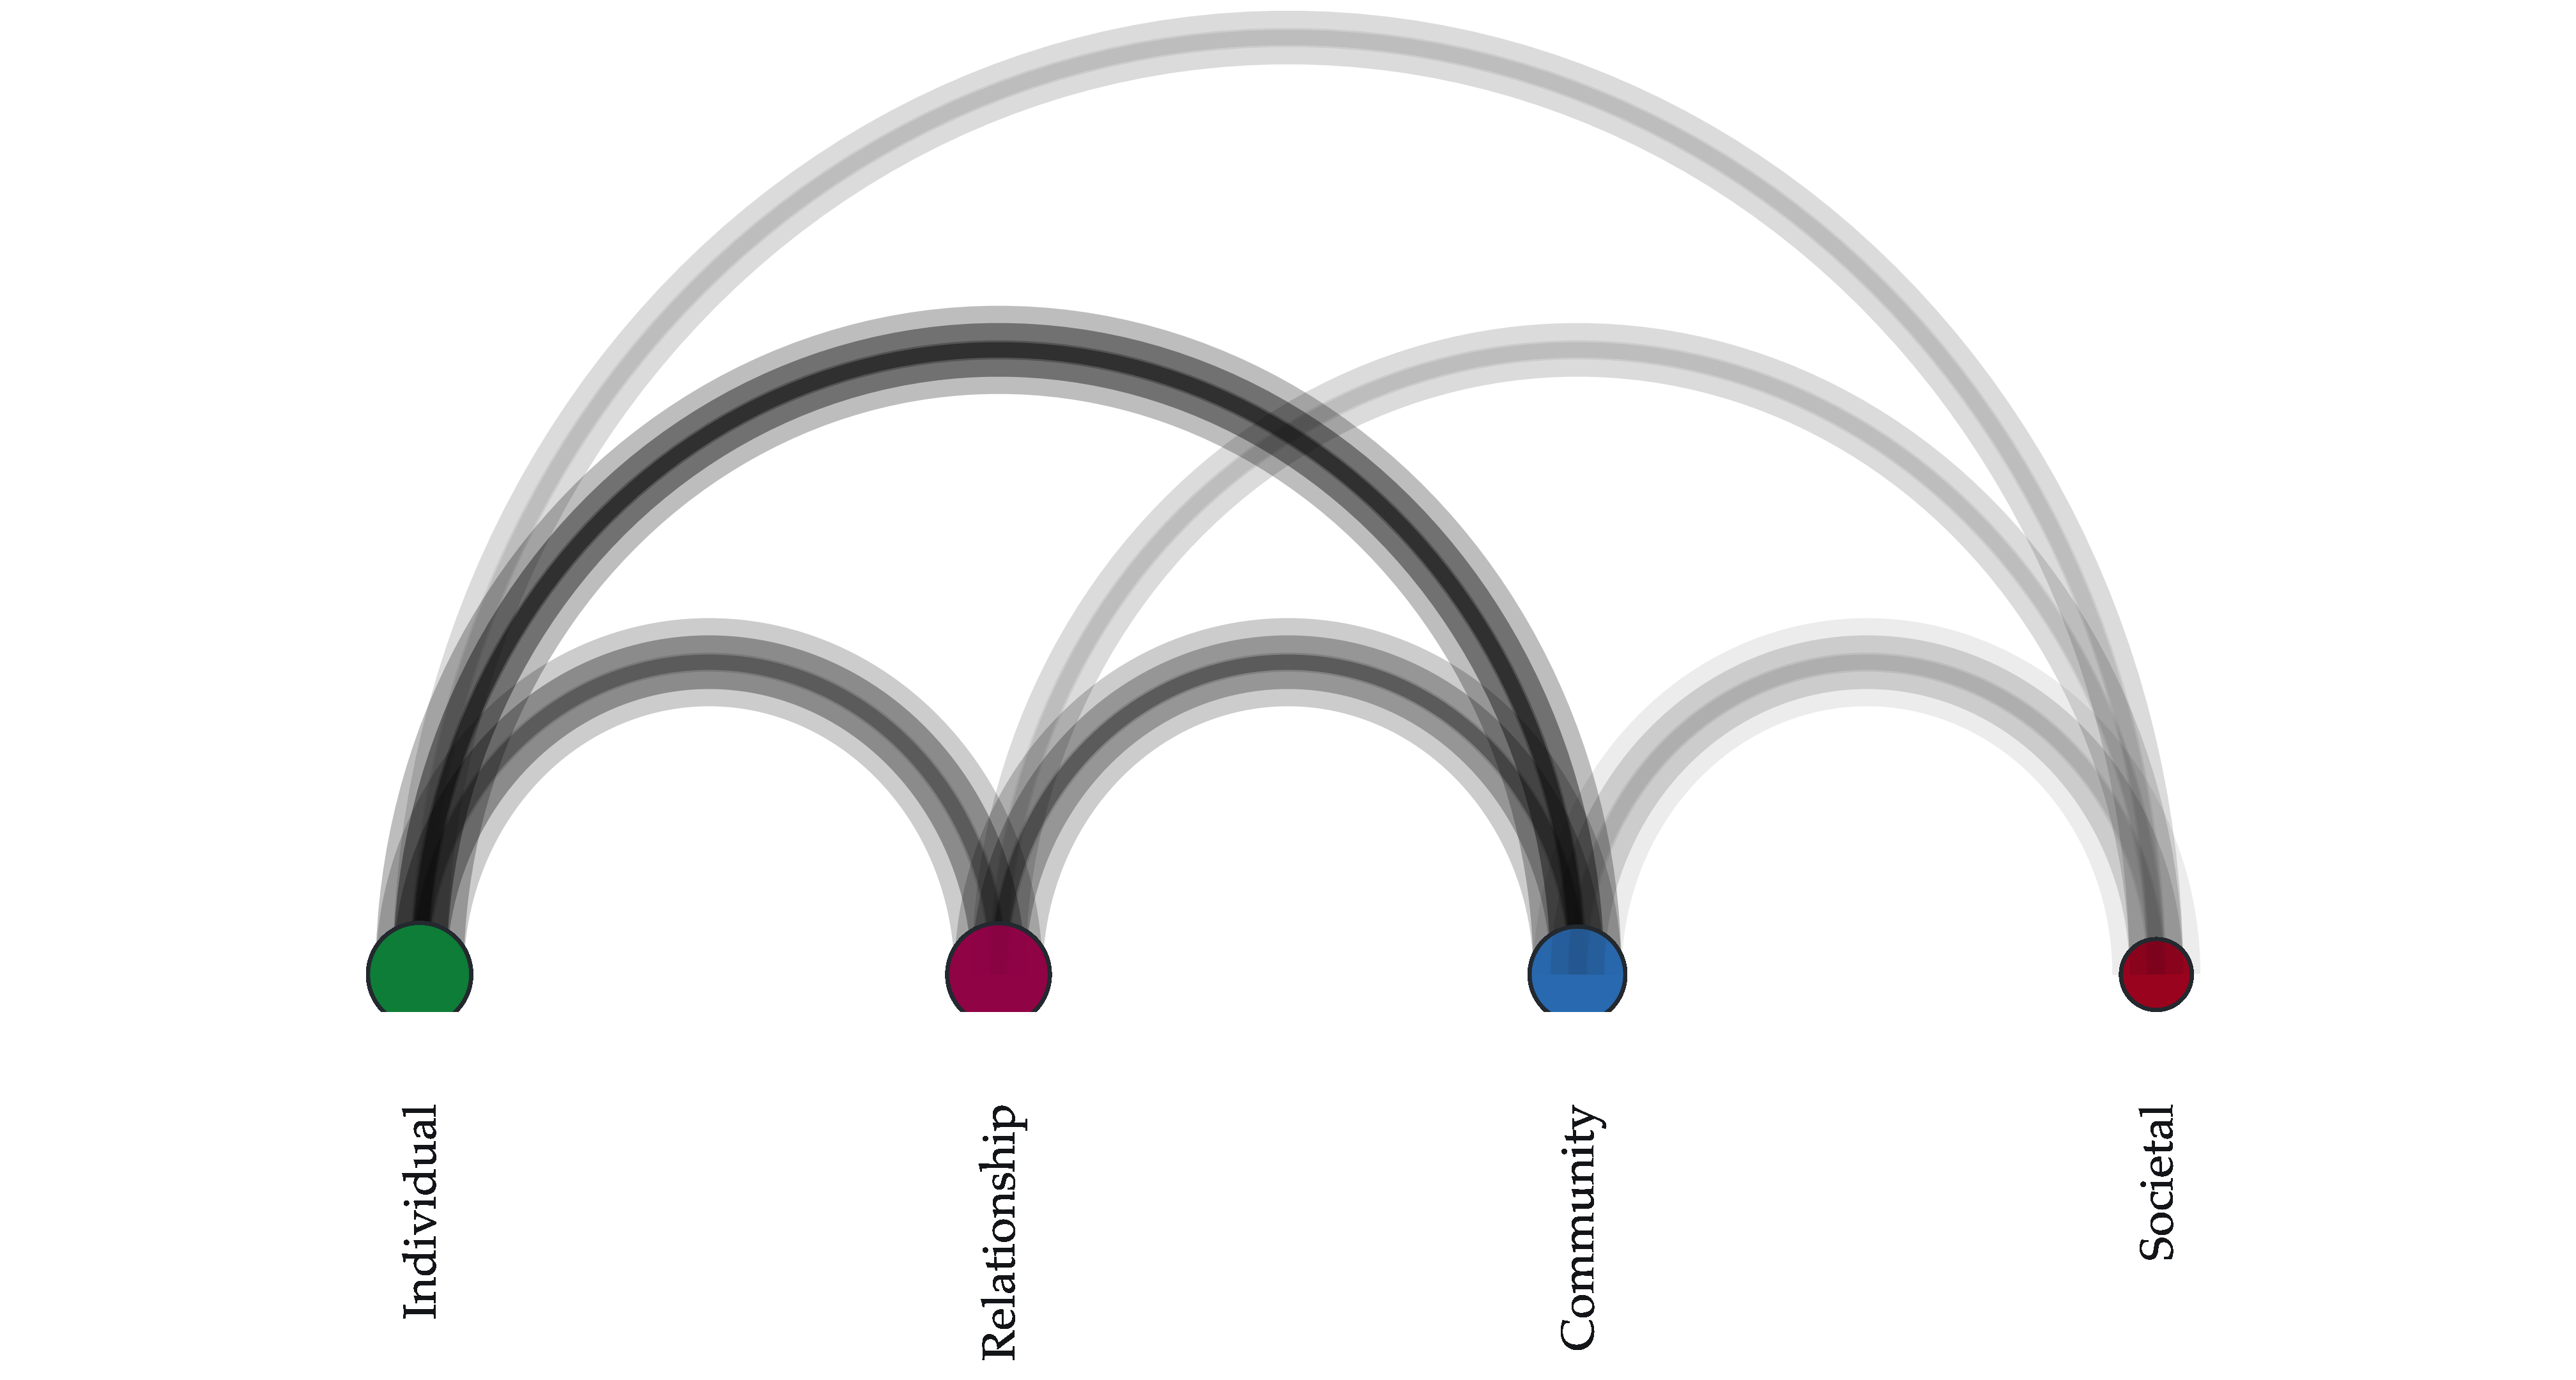
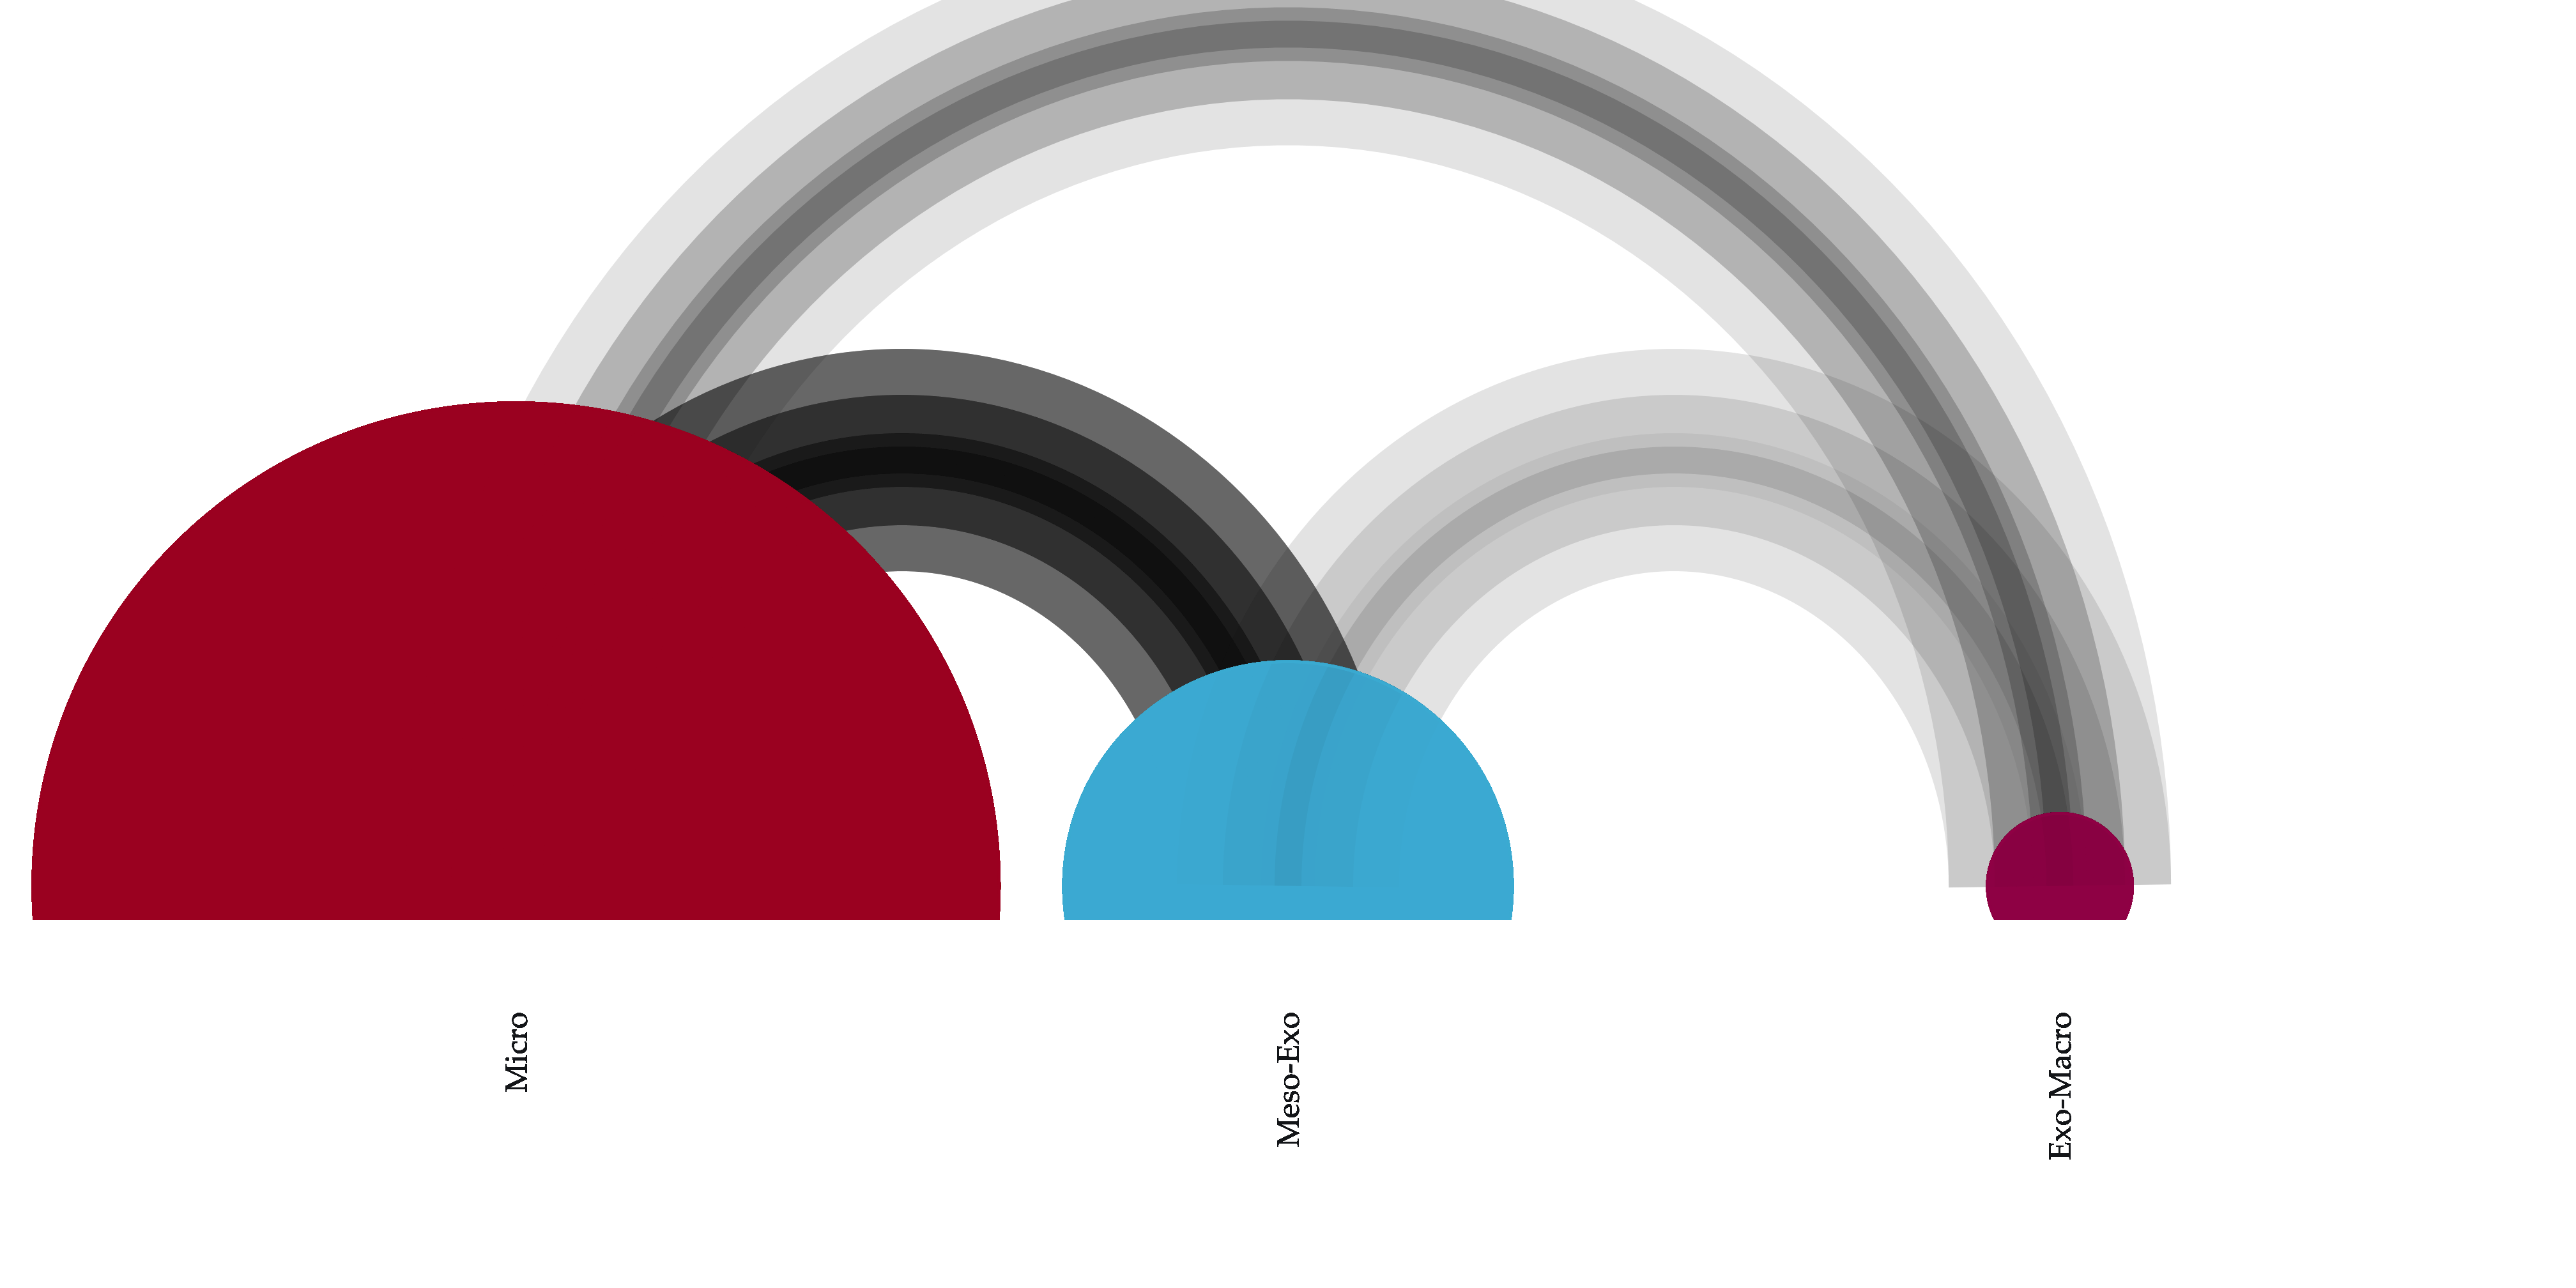
Base R GraphicsCluster PackageAllaire, J., Cheng, J., Xie, Y., McPherson, J., Chang, W., Allen, J., … Hyndman, R. (2016). rmarkdown: Dynamic documents for R. Retrieved from https://CRAN.R-project.org/package=rmarkdown
Arnold, J. B. (2016). ggthemes: Extra themes, scales and geoms for ggplot2. Retrieved from https://CRAN.R-project.org/package=ggthemes
Chang, W. (2014). extrafont: Tools for using fonts. Retrieved from https://CRAN.R-project.org/package=extrafont
Cleveland, W. S. (1984). Graphical methods for data presentation: Full scale breaks, dot charts, and multibased logging. The American Statistician, 38, 270–280.
Csardi, G., & Nepusz, T. (2006). The igraph software package for complex network research. Interjournal, Complex Systems, 1695. Retrieved from http://igraph.org
Daroczi, G., & Tsegelskyi, R. (2015). pander: An R pandoc writer. Retrieved from https://CRAN.R-project.org/package=pander
Databases, R. S. I. G. on. (2014). DBI: RDatabase interface. Retrieved from https://CRAN.R-project.org/package=DBI
Fox, J., & Weisberg, S. (2011). An R companion to applied regression (Second). Thousand Oaks CA: SAGE. Retrieved from http://socserv.socsci.mcmaster.ca/jfox/Books/Companion
Francois, R. (2014). bibtex: Bibtex parser. Retrieved from https://CRAN.R-project.org/package=bibtex
Huang, R. (2014). RQDA: R-based qualitative data analysis. Retrieved from http://rqda.r-forge.r-project.org/
Lawrence, M. (2015). cairoDevice: Embeddable cairo graphics device driver. Retrieved from https://CRAN.R-project.org/package=cairoDevice
Lawrence, M., & Temple Lang, D. (2010). RGtk2: A graphical user interface toolkit for R. Journal of Statistical Software, 37(8), 1–52. Retrieved from http://www.jstatsoft.org/v37/i08/
Lawrence, M., & Verzani, J. (2014). gWidgetsRGtk2: Toolkit implementation of gWidgets for RGtk2. Retrieved from https://CRAN.R-project.org/package=gWidgetsRGtk2
Qiu, Y. (2015). showtext: Using fonts more easily in RGraphs. Retrieved from https://CRAN.R-project.org/package=showtext
Qiu, Y., & others. (2015). sysfonts: Loading system fonts into R. Retrieved from https://CRAN.R-project.org/package=sysfonts
R Core Team. (2016). R: A language and environment for statistical computing. Vienna, Austria: R Foundation for Statistical Computing. Retrieved from https://www.R-project.org/
Robbins, N. P. (2006). Dot plots: A useful alternative to bar charts. Retrieved from http://www.b-eye-network.com/view/2468
Smith-Hunter, R. (2017). Riley: A developing package of r functions for (community-based) psychology research. Retrieved from https://github.com/EccRiley/Riley
Team, R. C., & worldwide. (2017). The R stats package. Retrieved from http://www.r-project.org/
Verzani, J. (2014). GWidgets: GWidgets API for building toolkit-independent, interactive GUIs. Retrieved from https://CRAN.R-project.org/package=gWidgets
Wickham, H. (2009). ggplot2: Elegant graphics for data analysis. Springer-Verlag New York. Retrieved from http://ggplot2.org
Wickham, H. (2011). The split-apply-combine strategy for data analysis. Journal of Statistical Software, 40(1), 1–29. Retrieved from http://www.jstatsoft.org/v40/i01/
Wickham, H. (2016a). scales: Scale functions for visualization. Retrieved from https://CRAN.R-project.org/package=scales
Wickham, H. (2016b). tidyr: Easily tidy data with spread() and gather() functions. Retrieved from https://CRAN.R-project.org/package=tidyr
Wickham, H., & Chang, W. (2016). devtools: Tools to make developing RPackages easier. Retrieved from https://CRAN.R-project.org/package=devtools
Wickham, H., & Francois, R. (2015). dplyr: A grammar of data manipulation. Retrieved from https://CRAN.R-project.org/package=dplyr
Wickham, H., James, D. A., & Falcon, S. (2014). RSQLite: SQLite interface for R. Retrieved from https://CRAN.R-project.org/package=RSQLite
Xie, Y. (2015). Dynamic documents with R and knitr (2nd ed.). Boca Raton, Florida: Chapman; Hall/CRC. Retrieved from http://yihui.name/knitr/
Xie, Y., & Allaire, J. (2016). tufte: Tufte’s styles for Rmarkdown documents. Retrieved from https://CRAN.R-project.org/package=tufte
Zhu, H. (2016). kableExtra: Decorate kable output using pipe syntax. Retrieved from https://github.com/haozhu233/kableExtra
Robbins (2006);Cleveland (1984)↩
Tufte CSS theme by Dave Liepmann & Edward Tufte
